Heng-Ru May Merkle-Tan

Applied ML | DATA SCIENTIST

About

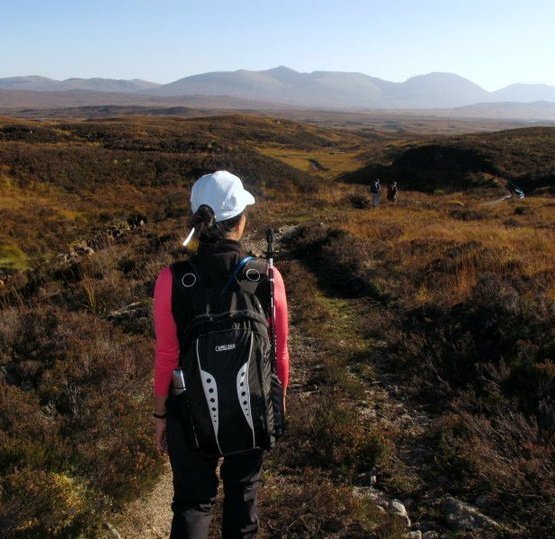
An explorer at heart, growing up and living in Singapore, Germany, the UK, and the USA have shaped the way I view the world and the experiences I seek. When not coding, modeling data or styling pixels, you can find me hillwalking, riding my vintage bicycle or discovering new places to enjoy a cuppa.

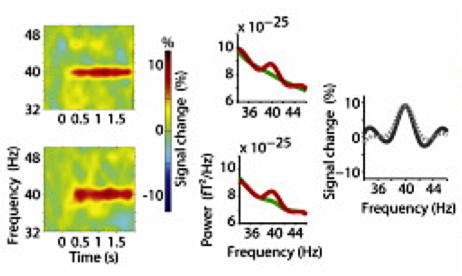
May trained as a neuroimaging scientist and studied brain functions in health and disease. Her love for the interdisciplinary process of discovery and translating findings into data stories paved a natural transition to applying data science in a broader context. Throughout her experience working with different data types e.g. brain (time-frequency), climate, geo-spatial, as well as unstructured (text) data, May finds joy in weaving her research experience in integrating high dimensional neuroimaging analysis with machine learning and statistical tools to discover insights.

Find out more about the work she has done and the things she's interested in discovering.


Experience

Here are few of the things I do with data and some of the tools and tech-stacks I have experience with.

Data Exploration | Mining

Time spent on getting to know your data and its limitations is time well-spent for subsequent data analysis and interpretation.

Statistical Analysis

Applying statistics to numerical analyses enable us to maximize our inference, appreciation and use of the findings.

Machine Learning

Using algorithms that iteratively learn from data, deriving hidden insights without explicit directions has useful applications in different scenarios.

Deep Learning

Complex patterns (e.g. object, speech) in large amounts of data can be learnt by harnessing computing power and training neural networks (e.g. using Keras | TensorFlow).

Brain Research

Studying how brain signals change in response to our interactions with the world in health and disease can help us understand how the brain functions.

Communication

Sharing what we do and discover is part of the scientific and social discourse.

Publications

Reviewing and publishing findings are relevant for the process of discovery.

Geo-Spatial Data Analysis | Viz

Integrating spatial information (e.g. using GeoPandas | geojson.io | OpenStreeMap) helps us see where things are located and gives context to data.

Python

Programming modules e.g. pandas | scikit-learn | nltk | matplotlib are the bread and butter of wrangling, modelling, and visualizing data.

R

An extensive range of statistical tools with great libaries e.g. for reading, manipulating, modeling, (interactively) visualizing, and reporting data.

Matlab

A research 'scripting' staple. Render interactive audio-visual experience using psychtoolbox or perform time-frequency and source analyses of neuroimaging data with fieldtrip.

AWS | EC2

Testing and developing neural networks, modeling large datasets, and deploying protoype web-applications are made easier with accessible GPUs instances and community AMIs.

Web Design | App

Weave HTML5 | CSS3 | Bootstrap (and some JS) to bring life to web content. Integrate front-end user-interactions with back-end data retrieval, modeling and response outcome.

Flask

Great for back-end prototype/micro web development with Python

D3.js

An accessible way to integrate data and scalable vector graphics (SVG) to create engaging and/or interactive online visualization.

Adobe Illustrator

A go-to for clean vector graphic designs and typography, as well as preparing scientific illustrations for publications.

Let's collaborate

Great discoveries, insights and creations do not happen in isolation.

~ Get in touch ~